Author Archives: Don

Sobering Statistics on Walking, Bicycling & the Race of Crash Victims in NC

The national debate over the safety of pedestrians and bicyclists on America’s streets oftentimes defaults to a discussion about trend-setters without recognizing that walking and bicycling are fundamental modes of urban transportation. In North Carolina, the General Assembly and Board of Transportation has systematically eliminated or drastically reduced funding for these basic transportation modes to the point that addressing their needs will never occur until policies change.

Unfortunately, these actions by policymakers and long-standing trends by the engineering profession to treat pedestrians and bicyclists as second-class citizens are having a detrimental effect on public health and the safety of our children and the most vulnerable users of the transportation system.

A deeper look at the pedestrian and bicyclist crash statistics in North Carolina from 1997 through 2010 reveals a more disturbing trend: How dangerous it is to be an African-American bicyclist or pedestrian.

A hallmark of NCDOT’s Bicycle and Pedestrian Transportation Division is its Pedestrian and Bicycle Crash Data Tool. If you haven’t perused the data for your community, you should see what the statistics say about where you live.

Basically, what I have found through analysis is that if you are African-American and live in North Carolina, you are:

  • Twice as likely to be involved in a crash if you are a pedestrian or bicyclist than if you are white;
  • 50% more likely to die as a pedestrian in a crash than if you are white;
  • 33% more like to die as a bicyclist in a crash than if you are white; and
  • Almost 2.5 times more likely to have your child involved in a pedestrian or bicyclist crash than if you are white.

These figures should shock you. They shocked me.

I then looked at the statistics for the 25 largest cities in North Carolina. Some city-specific statistics are:

  • Raleigh is 29.3% African-American; but 46.1% of the pedestrian crash victims, 60.3% of the child pedestrian crash victims and 62.5% of the child bicycle crash victims are African-American.
  • Wilmington is 19.9% African-American; but 40.8% of the pedestrian crashes in Wilmington involve African-Americans and 72.0% of the child pedestrian crash victims are African-American;
  • Fayetteville is 41.9% African-American. 77.8% of the child pedestrian crash victims are African-American.
  • Asheville is 13.4% African-American. 24.7% of the pedestrian crash victims are African-American.
  • Wilson is 49.7% African-American but 87% of the bicycle crash victims are African-American children.
  • Cary is 8.0% African-American but 15.9% of pedestrian crash victims are African-American and 19.7% of the child bicycle crash victims are African-American.
  • Rocky Mount is 61.3% African-American while 81.3% of child pedestrian crash victims are African-American and 67.5% of pedestrian crash victims are African-American.
  • Chapel Hill is 9.7% African-American but 29.3% of the pedestrian crash victims are African-American.

These statistics reflect many things beyond the race of the victim. They are tied to income and class issues, which is why they are an indicator for health concerns and tie directly to social determinants of health. (Police don’t collect income data when developing a crash report.)

They also reflect a need to advance more focused education and outreach efforts to low-income neighborhoods in addition to increased investment, a need for refinement of policies and prioritization methods to consider equity, and increased emphasis by cities, towns, counties, MPOs, and NCDOT to invest Transportation Alternative Program (TAP or TA) funds and other transportation funding sources to address these social equity issues.

The actions by the NC General Assembly and NC Board of Transportation to cut pedestrian and bicycle funding are leaving low-income communities more exposed to being victims of pedestrian and bicycle crashes, especially children.

As North Carolina sets program eligibility rules for their TAP funding, the pending requirement that projects that require right-of-way acquisition (or have minimal r/w acquisition) also appears to leave the low-income communities more vulnerable, as many pedestrian or bicycle facility improvement in city neighborhoods have fixed right-of-way when compared to suburban arterials in more affluent communities.

These statistics also emphasize the need to fully expend TAP and other non-motorized transportation funding instead of allowing tens of millions to go unspent, as was the case historically with the Transportation Enhancement and CMAQ programs.

Below are links to the spreadsheets with data tabulated for the 25 largest cities in North Carolina. See what you think. Then write your local elected officials, your NCDOT Board member and your MPO committees to let them know how you feel. I welcome your perspective.

Pedestrian Crash Data for NC’s 25 Largest Cities (1997-2010)
Bicyclist Crash Data for NC’s 25 Largest Cities (1997-2010)

Heart & Sole: A 5-year old’s journey to school

My daughter started kindergarten in August at a school that is 0.4 miles from our house. She’s an old hand at this, you see, as she attended pre-school at the same school and we walk to school every day.

Mommy takes a different route than Daddy, or so I hear. Sometimes we walk to the local bakery after school or stop for a beer (for me; she eats edamame) at the local micro-brewery. We cross the street at two intersections–one is signalized and another has a marked crosswalk.

“Sometimes the cars stop for us, Daddy” she says. “But only sometimes.” Sadly, only sometimes.

My daughter views this daily jaunt up the hill to school as an adventure. She doesn’t know that it’s exercise. About 1/3 of the way to school is her “wishing rock.” It’s nothing more than a pile of stones where the sidewalk ends into a utility pole. We routinely stop to talk about woolly worms crawling up a retaining wall. We look at the oak trees to see if the acorns are sprouting. We stop to talk to Frank–an elderly gentleman who lives along our walk route and sits on his porch most afternoons.

I have come to view her daily experience–and mine–as much more than physical activity. I view it as invaluable bonding time with my daughter. We have conversations about monkey bars, her friend’s upcoming birthday party, and her last weekend with Grandma–all without distractions such as smart phones, satellite radio and other drivers.

Sometimes my warped mind views this daily walk in “performance measures.” I guess that’s how I’m programmed.

In all, I estimate we have walked her to school 200 days per year since she was three years’ old. That equates to 800 trips (400 round-trips) on foot over the course of two years. That means she has walked a minimum of 320 miles just getting to and from school before she even entered kindergarten.

320 miles! More than 800,000 steps! 266 hours of walking! More than 30,000 calories burned! As a pre-schooler!

Yeah, I think in performance measures.

More than that, it means she has enjoyed 800 unique experiences exploring her own neighborhood. She connects with nature. She learns how to respect our elders. She compliments passersby about their dogs, their backpacks and their bicycles. She’s focused and ready to learn when we arrive at school. She decompresses from a long day on the walk home (as do I).

From this I realize that changing our habits and becoming more active happens one person, one family at a time–and it can be a powerful experience!

Walking in Rural Areas: A lesson from Western NC’s past?

Through my work in small towns and rural communities over the past several years I have come to the conclusion that the needs for non-motorized transportation facilities in these places are often overlooked, assumed not to exist, or are simply ignored in favor of other priorities or perceived needs. No funding programs exist to focus on non-motorized transportation

implementation specifically in rural areas or small towns. These communities sometimes overlook these needs because they think sidewalks are somehow urban phenomena.

You can find images of any small town or rural community from the early 1900s and see the streets packed with pedestrians. There’s a panoramic shot of Courthouse Square, circa 1930, hanging in Robbinsville’s Town Hall. The bicycle rack in the square is filled to capacity. We heard during the Buncombe County Greenways & Trails Plan that long, long ago in Barnardsville the kids would walk to school on a trail alongside the creek. People in rural areas walked to church, which meant they had to be within walking distance of rural outposts. This is one reason why so many churches dot our lush hillsides.

I was startled this spring in doing research on pedestrian crash rates in small towns in Western North Carolina to find out that the towns of Robbinsville (pop. 615) and Hayesville (pop. 300) had the highest pedestrian crash rates in WNC–by a large margin. Robbinsville’s rate was 30% higher than Hayesville’s and double the rate in Asheville. Individuals are doing great things in many of these communities to improve pedestrian safety. NCDOT recently installed three crosswalks and pedestrian refuge islands within 1,000 feet of one another along the three-lane US 129 Bypass in Robbinsville.

So how can we more effectively address this? Perhaps it’s simply a lesson we learned long ago.

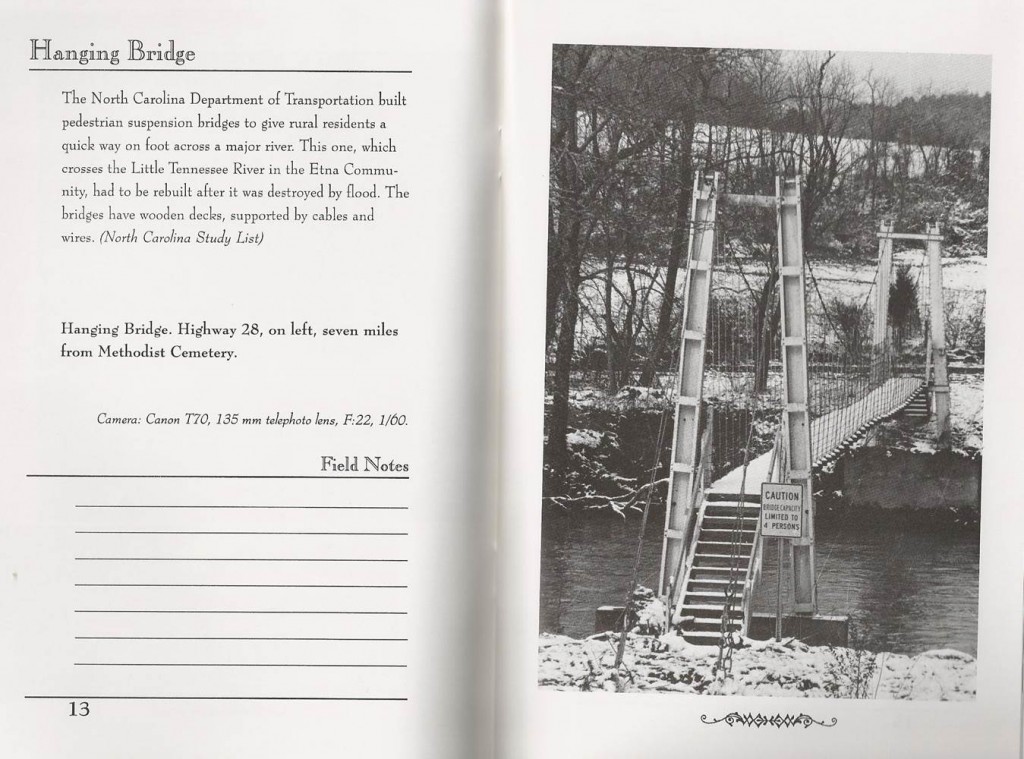
In searching through my mom’s collection of books published by the Macon County HistoricalSociety I came across the image pasted above. It’s a pedestrian bridge in rural Macon County constructed, according to the author, by the state DOT (its predecessor agency, most likely).

DOTs built pedestrians facilities long ago. Today, not so much.

DOTs built pedestrians facilities long ago. Today, not so much.

Today, we bicker about match ratios for sidewalks that amount to couch cushion change when compared to major highway widening projects. Many design practices default to minimum widths for pedestrian facilities. We can’t seem to convince decision-makers that crosswalks are vital. We struggle in building a curb ramp that would pass muster with a marginal Civil Rights attorney. We ponder whether or not pedestrians are part of a transportation system and our state’s largely rural-dominated General Assembly recently phased out the ability for our DOT to spend state funding on such public needs along public roads.

Do you think those were the thoughts of decision-makers when the pedestrian bridge in this picture was constructed? Or were they simply addressing what they saw as a fundamental human need to get from point A to point B (even if point A was a sorghum field and point B was a swimming hole)?